- Liquidität
Understanding cash burn & runway – the key metrics for your cash flow planning
In the world of startups, scale-ups and growth-oriented companies, two metrics are indispensable: cash burn and runway. They tell you how much money the company consumes each month – and how long the available cash will last. Especially in phases of high dynamism, new financing rounds or strong growth, these figures are decisive for planning ahead.
But not all cash burn is the same. And it does not stay constant. That makes it all the more important to keep the right figures in view regularly and in a differentiated way.
What does cash burn actually mean?
Cash burn describes the consumption of liquid funds over a given period – as a rule per month. Companies that are not yet, or not permanently, profitable burn “cash” in the classic sense in order to finance their growth.
But not every cash burn figure is equally meaningful. It is therefore worth looking at the three perspectives from which cash burn can be viewed:
1. Gross cash burn – the “pure expenditure view”
Gross cash burn adds up all monthly outgoing payments – regardless of income or one-off inflows. It answers the question:
“How high are my monthly obligations?”
Typically included here are:
- Personnel costs
- Rent and leasing
- Marketing and sales expenditure
- Consultants, service providers and external services
- General operating costs
This metric is particularly relevant for realistically assessing the fixed cost structure and ongoing expenditure – especially when the income side is changing significantly.
2. Net cash burn – the “true outflow of funds”
Net cash burn takes both incoming and outgoing payments into account. It is therefore the actual balance of the cash flows.
Income – expenditure = net cash burn
This perspective shows how much money is really being lost – and when a company might even start to build up liquidity, for example through rising revenue or falling costs.
3. Total cash burn – the complete liquidity picture
Total cash burn also includes one-off or exceptional effects – such as financing rounds, grants or loans. It shows the absolute change in the account balance over a defined period.
A one-off capital inflow can make total cash burn look positive – even if losses continue to arise operationally.
This perspective is ideal for seeing how total liquidity develops, independently of the operating business.
What is runway – and why is it so important?
Runway states how many months a company can still operate with the liquid funds currently available at an unchanged cash burn.
Example: with an account balance of EUR 100,000 and a net cash burn of EUR -20,000 per month, the runway is five months.
Runway is one of the central metrics in conversations with investors – but also in internal controlling. It creates transparency about when new financing will be needed or which measures have to be taken in order to avoid liquidity bottlenecks.
Why cash burn changes over time
Cash burn is not a static figure – it is dynamic. New employees, marketing campaigns, changed revenue streams or crises (for example supply shortages, economic uncertainty) can influence the figures massively.
That is why it is not enough to look at cash burn once a quarter. Anyone who takes their financial planning seriously should watch regularly:
- How expenditure develops
- Which income is actually realised
- Whether measures are working (e.g. cost reductions, new customers, subsidies)
How COMMITLY analyses cash burn – across four time perspectives
To make this dynamic tangible, COMMITLY calculates cash burn and runway on four different time levels – giving you a holistic view of how your liquidity is developing:
Average of the last 6 months
A stable, smoothed value – ideal for strategic analysis and communication with investors.
Shows the long-term trend and helps to put developments into realistic perspective.
Average of the last 3 months
A more focused look at recent changes in cash flow.
Visible here: cost increases or drops in revenue that are just beginning.
Last month
The actual figure – unvarnished and concrete.
Ideal for identifying outliers, special effects or short-term changes.
Average of the next 3 months (forecast)
Based on your forecast in liquidity planning – forward-looking planning.
Shows where cash burn is heading if planned measures or expected revenues materialise.
What users can learn from this
These four viewpoints show you not only how high your current cash burn is, but also:
- Whether your financial situation is improving or deteriorating
- Whether planned measures are taking effect
- How long your funds will last under different developments
- When you should act proactively – rather than only when it is too late
Conclusion: cash burn and runway – clarity instead of uncertainty
Cash burn is more than just a figure. It is an early warning system, a decision-making tool and a central indicator of financial health. And it is dynamic – which is why you need a system that makes this change visible.
COMMITLY gives you this transparency – in real time, across several periods and always with a view to what matters: the future of your company. The cash flow platform pulls the figures for that straight from your bank accounts.


Cash burn and runway, updated daily from your bank accounts.
Try it for free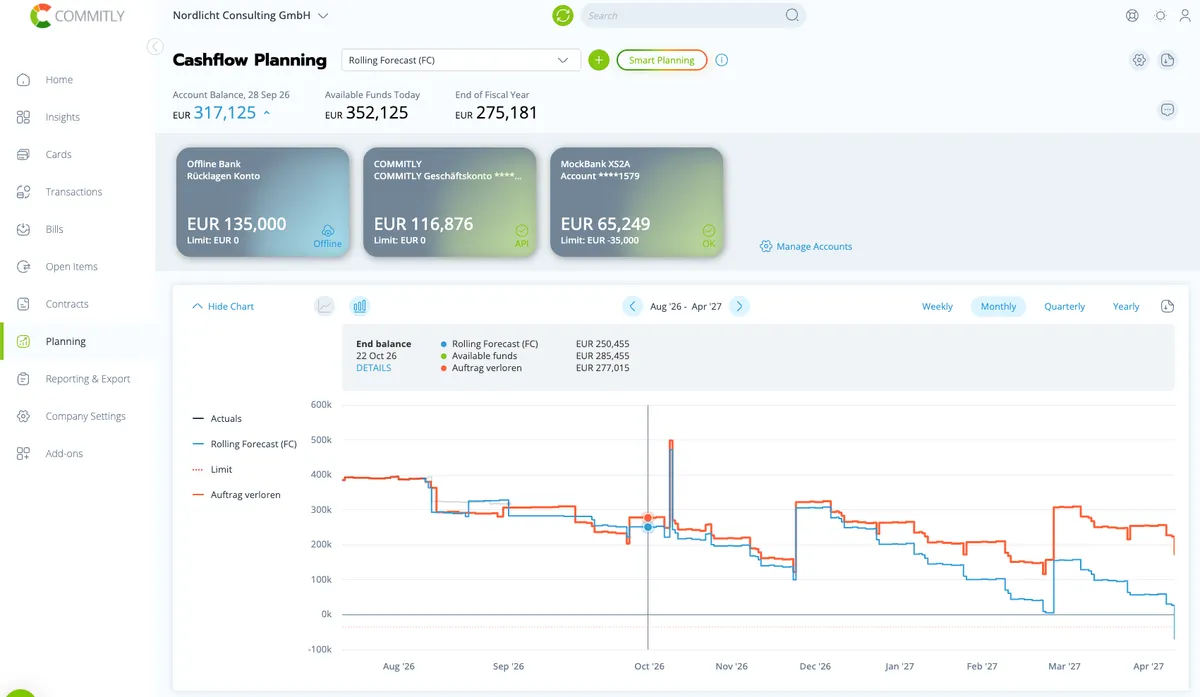

From reading to doing
You don't have to recalculate cash burn and runway in a spreadsheet every month — COMMITLY keeps both figures continuously up to date.